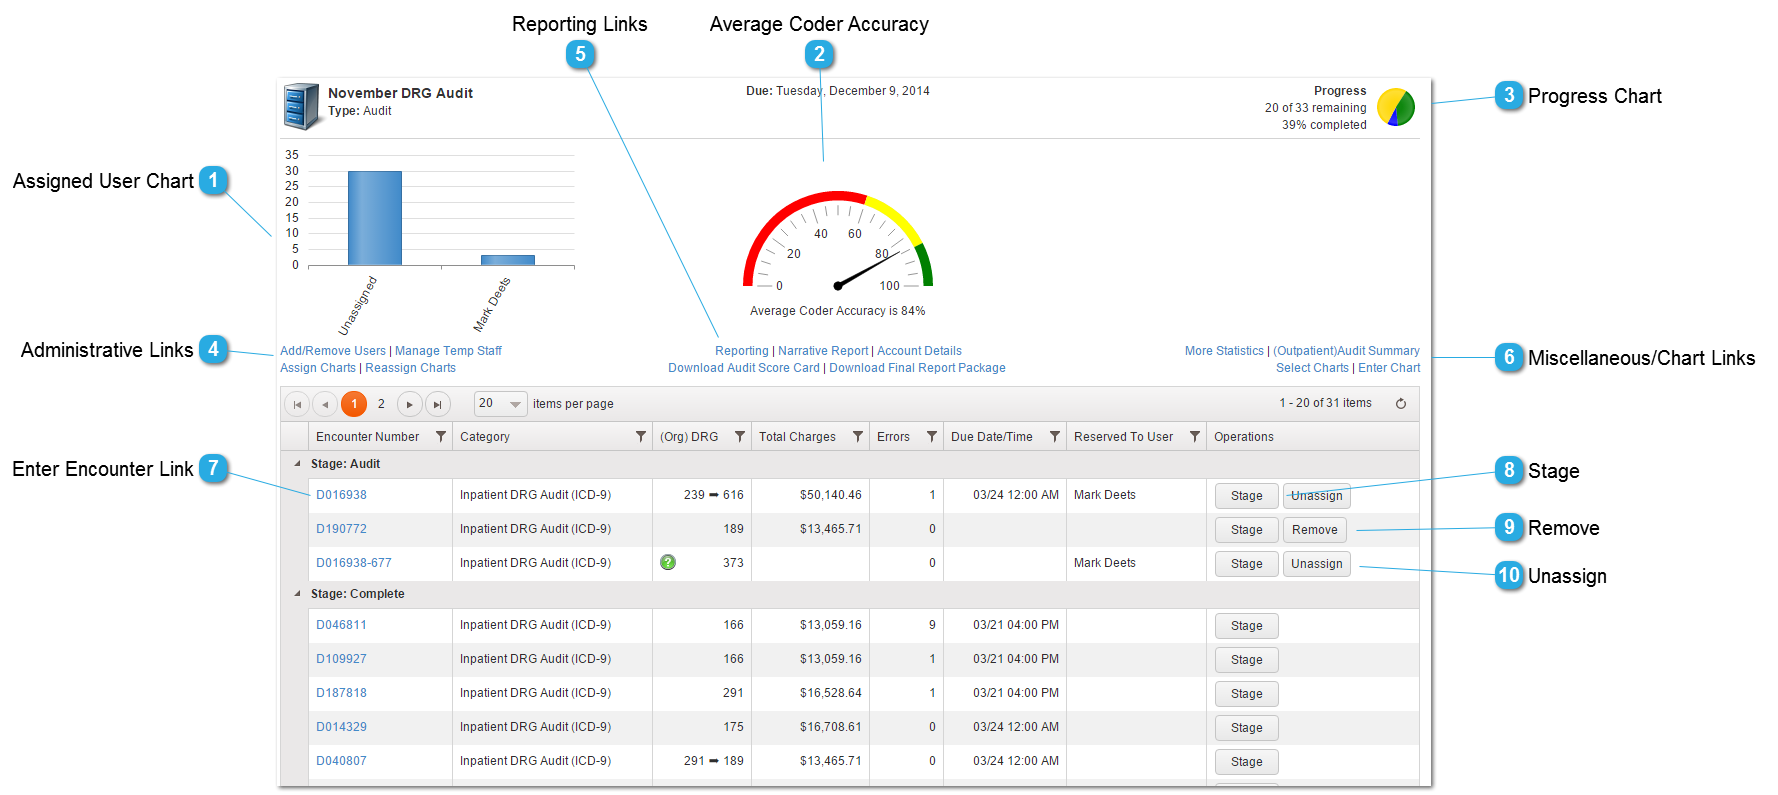
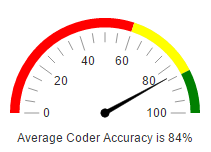
This is the main workpool detail screen. It shows all encounters assigned to the workpool, what stage they are in, who they are assigned to, a general overview of the state of the encounter including DRG changes and queries on the encounter, an overview of the average coder accuracy for all encounters in the workpool, and has many administrative options.
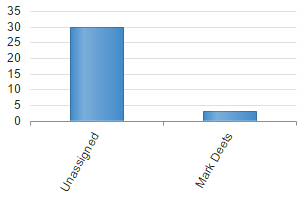
Assigned User Chart
This chart displays the amount of encounters assigned to each user so relative workloads can be easily identified.
These links are used by administrators and managers to oversee workpool options.
Add/Remove Users: This link allows the manager to add or remove auditors from the workpool. Only auditors in the workpool can audit charts in the workpool.
Manage Temp Staff: This link allows the manager to Edit, Merge, or make temp staff permanent in the system.
Assign Charts: This link allows the manager to assign specific charts to specific users. Only assigned auditors can audit assigned charts.
Reassign Charts: This link allows the manager to bulk reassign charts from one user to another.
Narrative Report: This link preapres a custom narrative report in Microsoft Word format and downloads it to the user's machine.
Account Details: Shows details of all accounts with changes in a single view.
Download Audit Score Card: Prepares and zips a file containing a Comparative DRG Audit Summary report and a DRG Audit Scorecard report for each facility in the parent client.
Download Final Report Package: Prepares and zips a file containing a Payer report and a DRG Executive Summary report for the parent facility.
Various miscellaneous and chart related links are shown here.
More Statistics: Displays a page listing the total encounters, total reimbursement variance, top 5 DRGs, and top 5 diagnosis errors for the workpool.
Audit Summary: Displays a page showing an overall audit summary for the workpool.
Select Charts: Opens the Select Charts page where a manager can select imported/coded charts to add to the workpool.
Enter Chart: Opens the Chart Settings dialog where an auditor can search for an existing demographic-only chart to begin coding, or can create an new encounter and begin coding.
Clicking this button allows a manager to change the stage of an encounter. For example, if a completed chart needs to be re-audited this is how this is accomplished.